---
author:
email: mail@petermolnar.net
image: https://petermolnar.net/favicon.jpg
name: Peter Molnar
url: https://petermolnar.net
copies:
- http://web.archive.org/web/20130623234040/http://petermolnar.eu:80/linux-tech-coding/lightweight-system-monitoring-with-collectd-and-jarmon
lang: en
published: '2013-04-30T14:16:14+00:00'
summary: 'The neverending story if using less and less resource for a process continues:
replacing Munin with collectd for system resource memories.'
tags:
- server
title: Lightweight resource monitoring with collectd and jarmon
---
## Moving away from Munin
For years I've been using Munin[^1] on my systems for graphs on system
resource usage. I've just recently discovered PyMunin[^2], a python
based extension that makes munin even more awesome. But as always, I've
encountered with limitations and problems.
First of all, Munin plugins are ugly. They come in various languages,
bash, Perl, Python, and so on, they does not share any similarities and
sometimes they even have dependencies not mentioned during the install
or in the readme.
Munin only has 5 minutes resolution - this is OK for some cases, but
today's requirements are changing, and it's really hard to change. Also,
the munin-node is basically periodical: at every 5 minute it runs
through the changes and compute the required data which result a small
CPU usage spike.
So I decided to go for something lighter, that runs as a daemon and does
not require hacked plugins to work. The result is: collectd[^3].
## Why collectd[^4]? {#why-collectd3}
In short, it's probaly the most light-weight, modest and really modular
data collector. It does not generate any graphs - that's done by
something else, on-demand. It's also very portable, suitable for both
large scale computing ( could be source for nagios ) and for embedded as
well. And it's fairly easy to configure.
## Setting up collectd
The install on Debian-like systems is just the regular apt-get way:
`sudo apt-get install collectd`.
My configuration currently monitors:
- basic system resources ( load, cpu )
- swap, ram & zram usage
- disk usage
- networking on port 80, 443 and 25
- nginx status
- PHP-FPM pool & PHP APC status ( see script below )
- Postfix status
- Fail2ban bans / unbans
Postifx & fail2ban are monitored with the tail plugins of collectd while
APC & FPM status is monitored with the curl\_json plugin.
`/etc/collectd/types.db`
``` {.apache}
accepted_conn count:COUNTER:0:134217728
idle_processes value:GAUGE:0:65535
active_processes value:GAUGE:0:65535
listen_queue value:GAUGE:0:65535
gauge_proc value:GAUGE:0:65535
gauge_max value:GAUGE:0:4294967295
ratio value:GAUGE:0:1
apc_counter value:DERIVE:U:U
mail_counter value:COUNTER:0:65535
```
`/etc/collectd/collectd.conf`
``` {.apache}
Hostname "localhost"
FQDNLookup true
BaseDir "/var/lib/collectd"
PluginDir "/usr/lib/collectd"
TypesDB "/usr/share/collectd/types.db" "/etc/collectd/types.db"
TypesDB "/usr/share/collectd/types.db"
Interval 30
Timeout 2
ReadThreads 4
LoadPlugin syslog
LogLevel info
LoadPlugin cpu
LoadPlugin curl_json
Instance "fpm_wp_network"
Type "accepted_conn"
Type "listen_queue"
Type "idle_processes"
Type "active_processes"
Instance "apc"
Type "gauge_max"
Type "apc_counter"
Type "apc_counter"
Type "apc_counter"
Type "gauge_max"
Type "gauge_max"
Type "apc_counter"
Type "apc_counter"
Type "apc_counter"
Type "gauge_max"
Type "gauge_max"
Type "gauge_max"
Type "ratio"
Type "ratio"
Type "gauge_max"
Type "gauge_max"
LoadPlugin df
Device "/dev/vda1"
MountPoint "/"
FSType "ext4"
IgnoreSelected false
ReportInodes false
LoadPlugin disk
LoadPlugin interface
Interface "eth0"
IgnoreSelected false
LoadPlugin load
LoadPlugin memcached
Host "127.0.0.1"
Port "11211"
LoadPlugin memory
LoadPlugin mysql
Socket "/var/run/mysqld/mysqld.sock"
User "debian-sys-maint"
Password "DEBIANPASSWORD"
LoadPlugin network
LoadPlugin nginx
URL "http://127.0.0.1/nginx-status"
LoadPlugin processes
LoadPlugin rrdtool
DataDir "/var/lib/collectd/rrd"
LoadPlugin tail
Instance "postfix"
Regex ""
DSType "CounterInc"
Type "mail_counter"
Instance "connection-in-open"
Regex ""
DSType "CounterInc"
Type "mail_counter"
Instance "connection-in-close"
Regex ""
DSType "CounterInc"
Type "mail_counter"
Instance "connection-in-lost"
Regex ""
DSType "CounterInc"
Type "mail_counter"
Instance "connection-in-timeout"
Regex ""
DSType "CounterInc"
Type "mail_counter"
Instance "connection-in-TLS-setup"
Regex ""
DSType "CounterInc"
Type "mail_counter"
Instance "connection-in-TLS-established"
Regex ""
DSType "CounterInc"
Type "mail_counter"
Instance "connection-out-TLS-setup"
Regex ""
DSType "CounterInc"
Type "mail_counter"
Instance "connection-out-TLS-established"
Regex "<554 5.7.1>"
DSType "CounterInc"
Type "mail_counter"
Instance "rejected"
Regex "<450 4.7.1>.*Helo command rejected: Host not found>"
DSType "CounterInc"
Type "mail_counter"
Instance "rejected-host_not_found"
Regex "<450 4.7.1>.*Client host rejected: No DNS entries for your MTA, HELO and Domain>"
DSType "CounterInc"
Type "mail_counter"
Instance "rejected-no_dns_entry"
#Regex "<450 4.7.1>.*Client host rejected: Mail appeared to be SPAM or forged>"
Regex ".*Service unavailable; client .* blocked using .*"
DSType "CounterInc"
Type "mail_counter"
Instance "rejected-spam_or_forged"
Regex "status=deferred"
DSType "CounterInc"
Type "mail_counter"
Instance "status-deferred"
Regex "status=forwarded"
DSType "CounterInc"
Type "mail_counter"
Instance "status-forwarded"
Regex "status=reject"
DSType "CounterInc"
Type "mail_counter"
Instance "status-reject"
Regex "status=sent"
DSType "CounterInc"
Type "mail_counter"
Instance "status-sent"
Regex "status=bounced"
DSType "CounterInc"
Type "mail_counter"
Instance "status-bounced"
Regex "status=SOFTBOUNCE"
DSType "CounterInc"
Type "mail_counter"
Instance "status-softbounce"
Regex "size=([0-9]*)"
DSType "CounterAdd"
Type "ipt_bytes"
Instance "size"
Regex "delay=([.0-9]*)"
DSType "GaugeAverage"
Type "gauge"
Instance "delay"
Regex "delays=([.0-9]*)/[.0-9]*/[.0-9]*/[.0-9]*"
DSType "GaugeAverage"
Type "gauge"
Instance "delay-before_queue_mgr"
Regex "delays=[.0-9]*/([.0-9]*)/[.0-9]*/[.0-9]*"
DSType "GaugeAverage"
Type "gauge"
Instance "delay-in_queue_mgr"
Regex "delays=[.0-9]*/[.0-9]*/([.0-9]*)/[.0-9]*"
DSType "GaugeAverage"
Type "gauge"
Instance "delay-setup_time"
Regex "delays=[.0-9]*/[.0-9]*/[.0-9]*/([.0-9]*)"
DSType "GaugeAverage"
Type "gauge"
Instance "delay-trans_time"
Instance "fail2ban"
Regex ".*Ban.*"
DSType "CounterInc"
Type "mail_counter"
Instance "ban"
Regex ".*Unban.*"
DSType "CounterInc"
Type "mail_counter"
Instance "unban"
LoadPlugin swap
ReportByDevice true
LoadPlugin tcpconns
LocalPort "80"
LocalPort "443"
LocalPort "25"
Include "/etc/collectd/filters.conf"
Include "/etc/collectd/thresholds.conf"
```
`http://127.0.0.1/apcjson.php`
``` {.php}
$seg_free_max) {
$seg_free_max = $block['size'];
}
if ($block['size'] < $MAX_FRAGMENT_SIZE) {
$seg_free_small += $block['size'];
}
$seg_free_total += $block['size'];
}
if ($seg_num_frag > 1) {
$total_num_frag += $seg_num_frag - 1;
$total_frag += $seg_free_total - $seg_free_max;
$total_free_small += $seg_free_small;
}
$total_free += $seg_free_total;
}
$frag_count = $total_num_frag;
$frag_avg_size = ($frag_count > 0) ? (float )$total_frag / $frag_count: 0;
switch ($algorithm) {
case 1:
$frag_ratio = ($total_free > 0) ? (float) $total_frag / $total_free : 0;
break;
default:
$frag_ratio = ($total_free > 0) ? (float) $total_free_small / $total_free : 0;
$algorithm = 0;
break;
}
$mem['fragmentation_algorithm'] = $algorithm;
$mem['fragmentation_ratio'] = $frag_ratio;
$mem['fragment_count'] = $frag_count;
$mem['fragment_avg_size'] = $frag_avg_size;
}
$json['memory'] = $mem;
print ( json_encode ( $json ) );
```
## Jarmon
Jarmon[^5] is a JavaScript base RRD visualizer - this makes the data
readable. It requires only a recepies.js file to work, my one has the
following in it:
`recepies.js`
``` {.js}
/* Copyright (c) Richard Wall
* See LICENSE for details.
*
* Some example recipes for Collectd RRD data - you *will* need to modify this
* based on the RRD data available on your system.
*/
if(typeof(jarmon) === 'undefined') {
var jarmon = {};
}
jarmon.TAB_RECIPES_STANDARD = [
['System', ['load','processes','cpu-0','cpu-1','cpu-2','cpu-3','fork-rate','memory','swap-io','swap-disk','swap-zram']],
['Disk', ['disk-vda1','disk-vda2']],
['Network', ['interface','tcpconns-25-local','tcpconns-80-local','tcpconns-443-local']],
['nginx', ['nginx-connections','nginx-requests']],
['memcached', ['memcached-hits','memcached-commands','memcached-du','memcached-items']],
['PHP', ['php-fpm-wp-network-stats','php-fpm-wp-network-processes','apc-memory','apc-entries','apc-fragmentation','apc-system','apc-user']],
['Postfix', ['postfix-status','postfix-rejected','postfix-connection-in','postfix-connection-out','postfix-stats']],
['Misc', ['fail2ban']],
];
jarmon.CHART_RECIPES_COLLECTD = {
'cpu-0': {
title: 'CPU0 Usage',
data: [
['data/cpu-0/cpu-idle.rrd', 0, 'Idle', '%'],
['data/cpu-0/cpu-interrupt.rrd', 0, 'Interrupt', '%'],
['data/cpu-0/cpu-nice.rrd', 0, 'Nice', '%'],
['data/cpu-0/cpu-softirq.rrd', 0, 'SoftIRQ', '%'],
['data/cpu-0/cpu-steal.rrd', 0, 'Steal', '%'],
['data/cpu-0/cpu-system.rrd', 0, 'System', '%'],
['data/cpu-0/cpu-user.rrd', 0, 'User', '%'],
['data/cpu-0/cpu-wait.rrd', 0, 'Wait', '%'],
],
options: jQuery.extend(true, {}, jarmon.Chart.BASE_OPTIONS,
jarmon.Chart.STACKED_OPTIONS)
},
'cpu-1': {
title: 'CPU1 Usage',
data: [
['data/cpu-1/cpu-idle.rrd', 0, 'Idle', '%'],
['data/cpu-1/cpu-interrupt.rrd', 0, 'Interrupt', '%'],
['data/cpu-1/cpu-nice.rrd', 0, 'Nice', '%'],
['data/cpu-1/cpu-softirq.rrd', 0, 'SoftIRQ', '%'],
['data/cpu-1/cpu-steal.rrd', 0, 'Steal', '%'],
['data/cpu-1/cpu-system.rrd', 0, 'System', '%'],
['data/cpu-1/cpu-user.rrd', 0, 'User', '%'],
['data/cpu-1/cpu-wait.rrd', 0, 'Wait', '%'],
],
options: jQuery.extend(true, {}, jarmon.Chart.BASE_OPTIONS,
jarmon.Chart.STACKED_OPTIONS)
},
'cpu-2': {
title: 'CPU2 Usage',
data: [
['data/cpu-2/cpu-idle.rrd', 0, 'Idle', '%'],
['data/cpu-2/cpu-interrupt.rrd', 0, 'Interrupt', '%'],
['data/cpu-2/cpu-nice.rrd', 0, 'Nice', '%'],
['data/cpu-2/cpu-softirq.rrd', 0, 'SoftIRQ', '%'],
['data/cpu-2/cpu-steal.rrd', 0, 'Steal', '%'],
['data/cpu-2/cpu-system.rrd', 0, 'System', '%'],
['data/cpu-2/cpu-user.rrd', 0, 'User', '%'],
['data/cpu-2/cpu-wait.rrd', 0, 'Wait', '%'],
],
options: jQuery.extend(true, {}, jarmon.Chart.BASE_OPTIONS,
jarmon.Chart.STACKED_OPTIONS)
},
'cpu-3': {
title: 'CPU3 Usage',
data: [
['data/cpu-3/cpu-idle.rrd', 0, 'Idle', '%'],
['data/cpu-3/cpu-interrupt.rrd', 0, 'Interrupt', '%'],
['data/cpu-3/cpu-nice.rrd', 0, 'Nice', '%'],
['data/cpu-3/cpu-softirq.rrd', 0, 'SoftIRQ', '%'],
['data/cpu-3/cpu-steal.rrd', 0, 'Steal', '%'],
['data/cpu-3/cpu-system.rrd', 0, 'System', '%'],
['data/cpu-3/cpu-user.rrd', 0, 'User', '%'],
['data/cpu-3/cpu-wait.rrd', 0, 'Wait', '%'],
],
options: jQuery.extend(true, {}, jarmon.Chart.BASE_OPTIONS,
jarmon.Chart.STACKED_OPTIONS)
},
'load': {
title: 'Load Average',
data: [
['data/load/load.rrd', 'shortterm', 'Short Term', ''],
['data/load/load.rrd', 'midterm', 'Medium Term', ''],
['data/load/load.rrd', 'longterm', 'Long Term', '']
],
options: jQuery.extend(true, {}, jarmon.Chart.BASE_OPTIONS)
},
'processes': {
title: 'Processes state',
data: [
['data/processes/ps_state-blocked.rrd', 0, 'Blocked', '#'],
['data/processes/ps_state-paging.rrd', 0, 'Paging', '#'],
['data/processes/ps_state-running.rrd', 0, 'Running', '#'],
['data/processes/ps_state-zombies.rrd', 0, 'Zombie', '#'],
['data/processes/ps_state-stopped.rrd', 0, 'Stopped', '#'],
['data/processes/ps_state-sleeping.rrd', 0, 'Sleeping', '#'],
],
options: jQuery.extend(true, {}, jarmon.Chart.BASE_OPTIONS,
jarmon.Chart.STACKED_OPTIONS)
},
'fork-rate': {
title: 'Fork rate',
data: [
['data/processes/fork_rate.rrd', 0, 'Fork rate', '#'],
],
options: jQuery.extend(true, {}, jarmon.Chart.BASE_OPTIONS,
jarmon.Chart.STACKED_OPTIONS)
},
'memory': {
title: 'Memory',
data: [
['data/memory/memory-buffered.rrd', 0, 'Buffered', 'B'],
['data/memory/memory-used.rrd', 0, 'Used', 'B'],
['data/memory/memory-cached.rrd', 0, 'Cached', 'B'],
['data/memory/memory-free.rrd', 0, 'Free', 'B']
],
options: jQuery.extend(true, {}, jarmon.Chart.BASE_OPTIONS,
jarmon.Chart.STACKED_OPTIONS)
},
'swap-io': {
title: 'Swap',
data: [
['data/swap/swap_io-in.rrd', 0, 'IO in', 'B'],
['data/swap/swap_io-out.rrd', 0, 'IO out', 'B'],
],
options: jQuery.extend(true, {}, jarmon.Chart.BASE_OPTIONS,
jarmon.Chart.STACKED_OPTIONS)
},
'swap-disk': {
title: 'Swap /dev/vda2',
data: [
['data/swap-dev_vda2/swap-free.rrd', 0, 'Free', 'Bytes'],
['data/swap-dev_vda2/swap-used.rrd', 0, 'Used', 'Bytes'],
],
options: jQuery.extend(true, {}, jarmon.Chart.BASE_OPTIONS,
jarmon.Chart.STACKED_OPTIONS)
},
'swap-zram': {
title: 'Zram swap',
data: [
['data/swap-dev_zram0/swap-free.rrd', 0, 'Zram0 Free', 'Bytes'],
['data/swap-dev_zram0/swap-used.rrd', 0, 'Zram0 Used', 'Bytes'],
['data/swap-dev_zram1/swap-free.rrd', 0, 'Zram1 Free', 'Bytes'],
['data/swap-dev_zram1/swap-used.rrd', 0, 'Zram1 Used', 'Bytes'],
['data/swap-dev_zram2/swap-free.rrd', 0, 'Zram2 Free', 'Bytes'],
['data/swap-dev_zram2/swap-used.rrd', 0, 'Zram2 Used', 'Bytes'],
['data/swap-dev_zram3/swap-free.rrd', 0, 'Zram3 Free', 'Bytes'],
['data/swap-dev_zram3/swap-used.rrd', 0, 'Zram3 Used', 'Bytes'],
],
options: jQuery.extend(true, {}, jarmon.Chart.BASE_OPTIONS,
jarmon.Chart.STACKED_OPTIONS)
},
'disk-vda1': {
title: '/dev/vda1 (root)',
data: [
['data/disk-vda1/disk_octets.rrd', 0, 'disk_octets', 'Bytes/s'],
['data/disk-vda1/disk_ops.rrd', 0, 'disk_ops', 'Ops/s'],
],
options: jQuery.extend(true, {}, jarmon.Chart.BASE_OPTIONS,
jarmon.Chart.STACKED_OPTIONS)
},
'disk-vda2': {
title: '/dev/vda2 (swap)',
data: [
['data/disk-vda2/disk_octets.rrd', 0, 'disk_octets', 'Bytes/s'],
['data/disk-vda2/disk_ops.rrd', 0, 'disk_ops', 'Ops/s'],
],
options: jQuery.extend(true, {}, jarmon.Chart.BASE_OPTIONS,
jarmon.Chart.STACKED_OPTIONS)
},
'interface': {
title: 'Interface',
data: [
['data/interface-eth0/if_octets.rrd', 0, 'if_octets', 'Bytes/s'],
['data/interface-eth0/if_packets.rrd', 0, 'if_packets', 'packets/s'],
['data/interface-eth0/if_errors.rrd', 0, 'if_errors', 'erros'],
],
options: jQuery.extend(true, {}, jarmon.Chart.BASE_OPTIONS,
jarmon.Chart.STACKED_OPTIONS)
},
'tcpconns-25-local': {
title: 'Port 25 (SMTP)',
data: [
['data/tcpconns-25-local/tcp_connections-CLOSING.rrd', 0, 'tcp_connections-CLOSING', ''],
['data/tcpconns-25-local/tcp_connections-SYN_SENT.rrd', 0, 'tcp_connections-SYN_SENT', ''],
['data/tcpconns-25-local/tcp_connections-LISTEN.rrd', 0, 'tcp_connections-LISTEN', ''],
['data/tcpconns-25-local/tcp_connections-TIME_WAIT.rrd', 0, 'tcp_connections-TIME_WAIT', ''],
['data/tcpconns-25-local/tcp_connections-SYN_RECV.rrd', 0, 'tcp_connections-SYN_RECV', ''],
['data/tcpconns-25-local/tcp_connections-CLOSE_WAIT.rrd', 0, 'tcp_connections-CLOSE_WAIT', ''],
['data/tcpconns-25-local/tcp_connections-CLOSED.rrd', 0, 'tcp_connections-CLOSED', ''],
['data/tcpconns-25-local/tcp_connections-LAST_ACK.rrd', 0, 'tcp_connections-LAST_ACK', ''],
['data/tcpconns-25-local/tcp_connections-FIN_WAIT1.rrd', 0, 'tcp_connections-FIN_WAIT1', ''],
['data/tcpconns-25-local/tcp_connections-FIN_WAIT2.rrd', 0, 'tcp_connections-FIN_WAIT2', ''],
['data/tcpconns-25-local/tcp_connections-ESTABLISHED.rrd', 0, 'tcp_connections-ESTABLISHED', ''],
],
options: jQuery.extend(true, {}, jarmon.Chart.BASE_OPTIONS,
jarmon.Chart.STACKED_OPTIONS)
},
'tcpconns-80-local': {
title: 'Port 80 (HTTP)',
data: [
['data/tcpconns-80-local/tcp_connections-CLOSING.rrd', 0, 'tcp_connections-CLOSING', ''],
['data/tcpconns-80-local/tcp_connections-SYN_SENT.rrd', 0, 'tcp_connections-SYN_SENT', ''],
['data/tcpconns-80-local/tcp_connections-LISTEN.rrd', 0, 'tcp_connections-LISTEN', ''],
['data/tcpconns-80-local/tcp_connections-TIME_WAIT.rrd', 0, 'tcp_connections-TIME_WAIT', ''],
['data/tcpconns-80-local/tcp_connections-SYN_RECV.rrd', 0, 'tcp_connections-SYN_RECV', ''],
['data/tcpconns-80-local/tcp_connections-CLOSE_WAIT.rrd', 0, 'tcp_connections-CLOSE_WAIT', ''],
['data/tcpconns-80-local/tcp_connections-CLOSED.rrd', 0, 'tcp_connections-CLOSED', ''],
['data/tcpconns-80-local/tcp_connections-LAST_ACK.rrd', 0, 'tcp_connections-LAST_ACK', ''],
['data/tcpconns-80-local/tcp_connections-FIN_WAIT1.rrd', 0, 'tcp_connections-FIN_WAIT1', ''],
['data/tcpconns-80-local/tcp_connections-FIN_WAIT2.rrd', 0, 'tcp_connections-FIN_WAIT2', ''],
['data/tcpconns-80-local/tcp_connections-ESTABLISHED.rrd', 0, 'tcp_connections-ESTABLISHED', ''],
],
options: jQuery.extend(true, {}, jarmon.Chart.BASE_OPTIONS,
jarmon.Chart.STACKED_OPTIONS)
},
'tcpconns-443-local': {
title: 'Port 443 (HTTPS)',
data: [
['data/tcpconns-443-local/tcp_connections-CLOSING.rrd', 0, 'tcp_connections-CLOSING', ''],
['data/tcpconns-443-local/tcp_connections-SYN_SENT.rrd', 0, 'tcp_connections-SYN_SENT', ''],
['data/tcpconns-443-local/tcp_connections-LISTEN.rrd', 0, 'tcp_connections-LISTEN', ''],
['data/tcpconns-443-local/tcp_connections-TIME_WAIT.rrd', 0, 'tcp_connections-TIME_WAIT', ''],
['data/tcpconns-443-local/tcp_connections-SYN_RECV.rrd', 0, 'tcp_connections-SYN_RECV', ''],
['data/tcpconns-443-local/tcp_connections-CLOSE_WAIT.rrd', 0, 'tcp_connections-CLOSE_WAIT', ''],
['data/tcpconns-443-local/tcp_connections-CLOSED.rrd', 0, 'tcp_connections-CLOSED', ''],
['data/tcpconns-443-local/tcp_connections-LAST_ACK.rrd', 0, 'tcp_connections-LAST_ACK', ''],
['data/tcpconns-443-local/tcp_connections-FIN_WAIT1.rrd', 0, 'tcp_connections-FIN_WAIT1', ''],
['data/tcpconns-443-local/tcp_connections-FIN_WAIT2.rrd', 0, 'tcp_connections-FIN_WAIT2', ''],
['data/tcpconns-443-local/tcp_connections-ESTABLISHED.rrd', 0, 'tcp_connections-ESTABLISHED', ''],
],
options: jQuery.extend(true, {}, jarmon.Chart.BASE_OPTIONS,
jarmon.Chart.STACKED_OPTIONS)
},
'nginx-connections': {
title: 'NGiNX connections',
data: [
['data/nginx/nginx_connections-active.rrd', 0, 'Active connections', '#'],
['data/nginx/nginx_connections-reading.rrd', 0, 'Reading connections', '#'],
['data/nginx/nginx_connections-waiting.rrd', 0, 'Waiting connections', '#'],
['data/nginx/nginx_connections-writing.rrd', 0, 'Writing connections', '#'],
],
options: jQuery.extend(true, {}, jarmon.Chart.BASE_OPTIONS,
jarmon.Chart.STACKED_OPTIONS)
},
'nginx-requests': {
title: 'NGiNX requests',
data: [
['data/nginx/nginx_requests.rrd', 0, 'Req/s', '#'],
],
options: jQuery.extend(true, {}, jarmon.Chart.BASE_OPTIONS,
jarmon.Chart.STACKED_OPTIONS)
},
'memcached-hits': {
title: 'memcached hits stats',
data: [
['data/memcached/memcached_ops-hits.rrd', 0, 'Hits', '#'],
['data/memcached/memcached_ops-misses.rrd', 0, 'Misses', '#'],
['data/memcached/percent-hitratio.rrd', 0, 'Hitratio', '%'],
],
options: jQuery.extend(true, {}, jarmon.Chart.BASE_OPTIONS,
jarmon.Chart.STACKED_OPTIONS)
},
'memcached-commands': {
title: 'memcached commands stats',
data: [
['data/memcached/memcached_command-flush.rrd', 0, 'FLUSH', '#'],
['data/memcached/memcached_command-get.rrd', 0, 'GET', '#'],
['data/memcached/memcached_command-set.rrd', 0, 'SET', '#'],
['data/memcached/memcached_command-touch.rrd', 0, 'TOUCH', '#'],
],
options: jQuery.extend(true, {}, jarmon.Chart.BASE_OPTIONS,
jarmon.Chart.STACKED_OPTIONS)
},
'memcached-du': {
title: 'memcached items',
data: [
['data/memcached/df-cache.rrd', 0, 'Used space', 'Bytes'],
],
options: jQuery.extend(true, {}, jarmon.Chart.BASE_OPTIONS,
jarmon.Chart.STACKED_OPTIONS)
},
'memcached-items': {
title: 'memcached memory usage',
data: [
['data/memcached/memcached_items-current.rrd', 0, 'Curremt items', 'Entries'],
],
options: jQuery.extend(true, {}, jarmon.Chart.BASE_OPTIONS,
jarmon.Chart.STACKED_OPTIONS)
},
'php-fpm-wp-network-stats': {
title: 'PHP FPM for WP-Network',
data: [
['data/curl_json-fpm_wp_network/accepted_conn-accepted conn.rrd', 0, 'Accepted connections', ''],
//['data/curl_json-fpm_wp_network/listen_queue-listen queue.rrd', 0, 'Listen queue', ''],
],
options: jQuery.extend(true, {}, jarmon.Chart.BASE_OPTIONS,
jarmon.Chart.STACKED_OPTIONS)
},
'php-fpm-wp-network-processes': {
title: 'PHP FPM for WP-Network',
data: [
['data/curl_json-fpm_wp_network/active_processes-active processes.rrd', 0, 'Active processes', ''],
['data/curl_json-fpm_wp_network/idle_processes-idle processes.rrd', 0, 'Idle processes', ''],
//['data/curl_json-fpm_wp_network/total_processes-total processes.rrd', 0, 'Total processes', ''],
],
options: jQuery.extend(true, {}, jarmon.Chart.BASE_OPTIONS,
jarmon.Chart.STACKED_OPTIONS)
},
'apc-memory': {
title: 'APC memory usage',
data: [
['data/curl_json-apc/gauge_max-cache_sys-mem_size.rrd', 0, 'System cache', 'Bytes'],
['data/curl_json-apc/gauge_max-cache_user-mem_size.rrd', 0, 'User cache', 'Bytes'],
['data/curl_json-apc/gauge_max-memory-avail_mem.rrd', 0, 'Free', 'Bytes'],
],
options: jQuery.extend(true, {}, jarmon.Chart.BASE_OPTIONS,
jarmon.Chart.STACKED_OPTIONS)
},
'apc-entries': {
title: 'APC entries',
data: [
['data/curl_json-apc/gauge_max-cache_sys-num_entries.rrd', 0, 'System cache entries', '#'],
['data/curl_json-apc/gauge_max-cache_user-num_entries.rrd', 0, 'User cache entries', '#'],
],
options: jQuery.extend(true, {}, jarmon.Chart.BASE_OPTIONS,
jarmon.Chart.STACKED_OPTIONS)
},
'apc-fragmentation': {
title: 'APC memory fragmentation',
data: [
['data/curl_json-apc/ratio-memory-utilization_ratio.rrd', 0, 'Utilization', ''],
['data/curl_json-apc/ratio-memory-fragmentation_ratio.rrd', 0, 'Fragmentation', ''],
],
options: jQuery.extend(true, {}, jarmon.Chart.BASE_OPTIONS,
jarmon.Chart.STACKED_OPTIONS)
},
'apc-system': {
title: 'APC system cache stats',
data: [
['data/curl_json-apc/apc_counter-cache_sys-num_hits.rrd', 0, 'Hits', ''],
['data/curl_json-apc/apc_counter-cache_sys-num_inserts.rrd', 0, 'Inserts', ''],
['data/curl_json-apc/apc_counter-cache_sys-num_misses.rrd', 0, 'Misses', ''],
],
options: jQuery.extend(true, {}, jarmon.Chart.BASE_OPTIONS,
jarmon.Chart.STACKED_OPTIONS)
},
'apc-user': {
title: 'APC user cache stats',
data: [
['data/curl_json-apc/apc_counter-cache_user-num_hits.rrd', 0, 'Hits', ''],
['data/curl_json-apc/apc_counter-cache_user-num_inserts.rrd', 0, 'Inserts', ''],
['data/curl_json-apc/apc_counter-cache_user-num_misses.rrd', 0, 'Misses', ''],
],
options: jQuery.extend(true, {}, jarmon.Chart.BASE_OPTIONS,
jarmon.Chart.STACKED_OPTIONS)
},
'postfix-rejected': {
title: 'Postfix rejected',
data: [
['data/tail-postfix/mail_counter-rejected-host_not_found.rrd', 0, 'Host not found', ''],
['data/tail-postfix/mail_counter-rejected-no_dns_entry.rrd', 0, 'No DNS Entry', ''],
['data/tail-postfix/mail_counter-rejected.rrd', 0, 'Rejected', ''],
['data/tail-postfix/mail_counter-rejected-spam_or_forged.rrd', 0, 'Spam or forged', ''],
],
options: jQuery.extend(true, {}, jarmon.Chart.BASE_OPTIONS,
jarmon.Chart.STACKED_OPTIONS)
},
'postfix-status': {
title: 'Postfix status',
data: [
['data/tail-postfix/mail_counter-status-bounced.rrd', 0, 'Bounced', ''],
['data/tail-postfix/mail_counter-status-deferred.rrd', 0, 'Deferred', ''],
['data/tail-postfix/mail_counter-status-forwarded.rrd', 0, 'Forwarded', ''],
['data/tail-postfix/mail_counter-status-reject.rrd', 0, 'Reject', ''],
['data/tail-postfix/mail_counter-status-sent.rrd', 0, 'Sent', ''],
['data/tail-postfix/mail_counter-status-softbounce.rrd', 0, 'Softbounce', ''],
],
options: jQuery.extend(true, {}, jarmon.Chart.BASE_OPTIONS,
jarmon.Chart.STACKED_OPTIONS)
},
'postfix-connection-in': {
title: 'Postfix IN connections',
data: [
['data/tail-postfix/mail_counter-connection-in-close.rrd', 0, 'Closed', ''],
['data/tail-postfix/mail_counter-connection-in-lost.rrd', 0, 'Lost', ''],
['data/tail-postfix/mail_counter-connection-in-open.rrd', 0, 'Open', ''],
['data/tail-postfix/mail_counter-connection-in-timeout.rrd', 0, 'Timeout', ''],
['data/tail-postfix/mail_counter-connection-in-TLS-established.rrd', 0, 'TLS Established', ''],
['data/tail-postfix/mail_counter-connection-in-TLS-setup.rrd', 0, 'TLS Setup', ''],
],
options: jQuery.extend(true, {}, jarmon.Chart.BASE_OPTIONS,
jarmon.Chart.STACKED_OPTIONS)
},
'postfix-connection-out': {
title: 'Postfix OUT connections',
data: [
['data/tail-postfix/mail_counter-connection-out-TLS-established.rrd', 0, 'TLS Established', ''],
['data/tail-postfix/mail_counter-connection-out-TLS-setup.rrd', 0, 'TLS Setup', ''],
],
options: jQuery.extend(true, {}, jarmon.Chart.BASE_OPTIONS,
jarmon.Chart.STACKED_OPTIONS)
},
'postfix-stats': {
title: 'Postfix stats',
data: [
['data/tail-postfix/gauge-delay-before_queue_mgr.rrd', 0, 'Before queue', ''],
['data/tail-postfix/gauge-delay-in_queue_mgr.rrd', 0, 'In queue', ''],
['data/tail-postfix/gauge-delay.rrd', 0, 'Delay', ''],
['data/tail-postfix/gauge-delay-setup_time.rrd', 0, 'Setup time', ''],
['data/tail-postfix/gauge-delay-trans_time.rrd', 0, 'Transitional', ''],
['data/tail-postfix/ipt_bytes-size.rrd', 0, 'Bytes size', ''],
],
options: jQuery.extend(true, {}, jarmon.Chart.BASE_OPTIONS,
jarmon.Chart.STACKED_OPTIONS)
},
'fail2ban': {
title: 'Fail2ban stats',
data: [
['data/tail-fail2ban/mail_counter-ban.rrd', 0, 'Ban', ''],
['data/tail-fail2ban/mail_counter-unban.rrd', 0, 'Unban', ''],
],
options: jQuery.extend(true, {}, jarmon.Chart.BASE_OPTIONS,
jarmon.Chart.STACKED_OPTIONS)
},
};
```
The outcome: the drop at the load at the beginning of the graph is where
the munin-node was turned off. 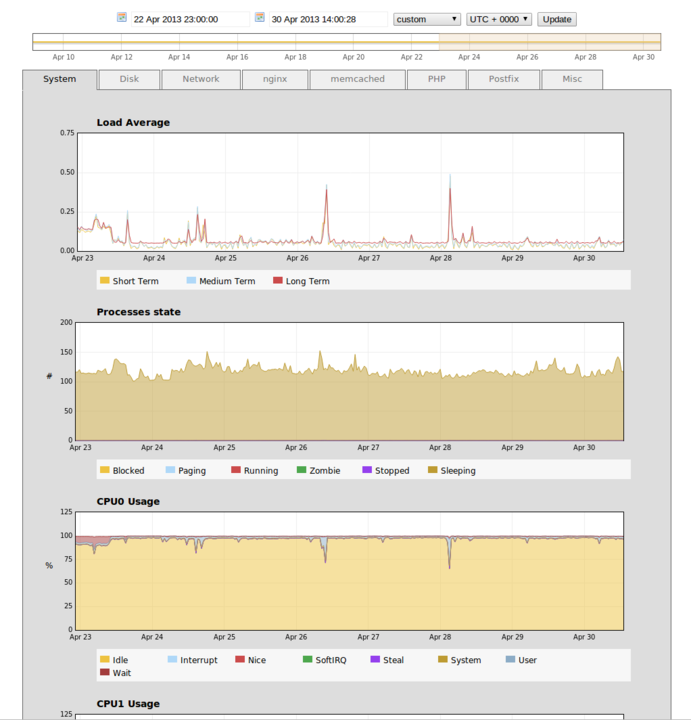
[^1]:
[^2]:
[^3]:
[^4]:
[^5]: